This tile shows the number of sensors reporting the current pollutant in the map. Sites without data for more than 3 hours are excluded.
More information
This tile shows the 5-day pollutant trend for all sensors reporting.
More information
This tile shows the highest ranked AQI sites for the pollutant shown in the map.
More information
Click a site to include or remove it from the chart below. Small black squares are grab samples near pollutant sites -- click one to see only that site.
Lifers Leaving a Legacy is an Oakland-based organization founded by Mr. Charles Reed building on principles of redemption, restoration, and service. Guided by the belief that lasting change comes from preparation and opportunity rather than chance, Lifers works to turn residents' own knowledge of their neighborhoods into informed action, treating community members as partners in science and solution-building rather than only recipients of it.
Project Overview
With support from California Climate Investments (CCI), Lifers is building a highly specialized air quality monitoring network within Oakland. This network focuses on pollutants such as ozone and particulate matter but also samples toxic pollutants such as black carbon, volatile organic compounds (VOCs), and metals. Together, this network goes well beyond typical community monitoring in an effort to more thoroughly understand air pollutants impacting the people of Oakland.
This work is a continuation of air quality monitoring done by Lifers in 2025. To download the data and the report associated with the 2025 campaign, see the links below.
The Air Quality Index (AQI) is the U.S. EPA's standard scale for translating pollutant concentrations into a single number to communicate about outdoor air quality and health. It runs from 0 to 500 and is split into six color-coded categories, from Good to Hazardous. The higher the AQI value, the greater the level of air pollution and health concern. For example, an AQI value of 50 or below represents good air quality, while an AQI value over 300 represents hazardous air quality. The AQI is calculated for specific pollutants (but not all pollutants) including PM₂.₅, PM₁₀, NO₂, CO, and Ozone.
Each of the six AQI categories has a specific color to make it easy for people to quickly determine whether the air quality is good or reaching unhealthy levels.
The Map's default view shows "Overall AQI", which is a combination of AQI from five different pollutants to provide a single value. PM₂.₅, PM₁₀, NO₂, CO, and Ozone values are used to calculate the Overall AQI, but each pollutant can also be viewed on their own in the Map.
Pollutant-specific AQI
The concentration ranges of each pollutant differ for each AQI category. The various concentration ranges for each AQI category are shown in the table below. Where a location has readings for more than one pollutant, its overall AQI is whichever pollutant is highest at that time, not an average across pollutants.
Some pollutants shown here use NowCast instead of a plain instantaneous AQI. NowCast is an EPA method that turns the last several hours of readings into a single number, weighting the most recent hours more heavily than older ones. That makes it react almost as quickly as a plain instantaneous reading when conditions are changing fast (for example, during a wildfire smoke event), while smoothing out brief single-hour spikes that a plain instantaneous AQI would show. PM₂.₅ and PM₁₀ use NowCast here; NO₂/NOₓ, CO, and ozone instead use a plain instantaneous AQI, computed directly from that hour's readings.
Source: EPA,Technical Assistance Document for the Reporting of Daily Air Quality – the Air Quality Index (AQI). NOₓ has no official EPA AQI and is shown here using the NO₂ scale. Ozone is evaluated against its 8-hour breakpoints using our 1-hour sensor readings as an approximation. PM₂.₅ and PM₁₀'s AQI is NowCast-based (a 12-hour weighted average that responds quickly to changing conditions), not a plain instantaneous reading, matching AirNow's own real-time reporting convention; NOₓ, CO, and ozone stay instantaneous. BC (black carbon) has no official EPA AQI at all and does not appear in this table. See the Map tab's legend for its separate concentration-bin scale.
Pollutants and sources
PM2.5
Fine particulate matter, 2.5 microns or smaller. PM₂.₅ penetrates deep into the lungs and is linked to respiratory and cardiovascular effects. The main sources of PM₂.₅ include vehicle exhaust, wood burning and wildfire smoke, and industrial combustion.
PM10
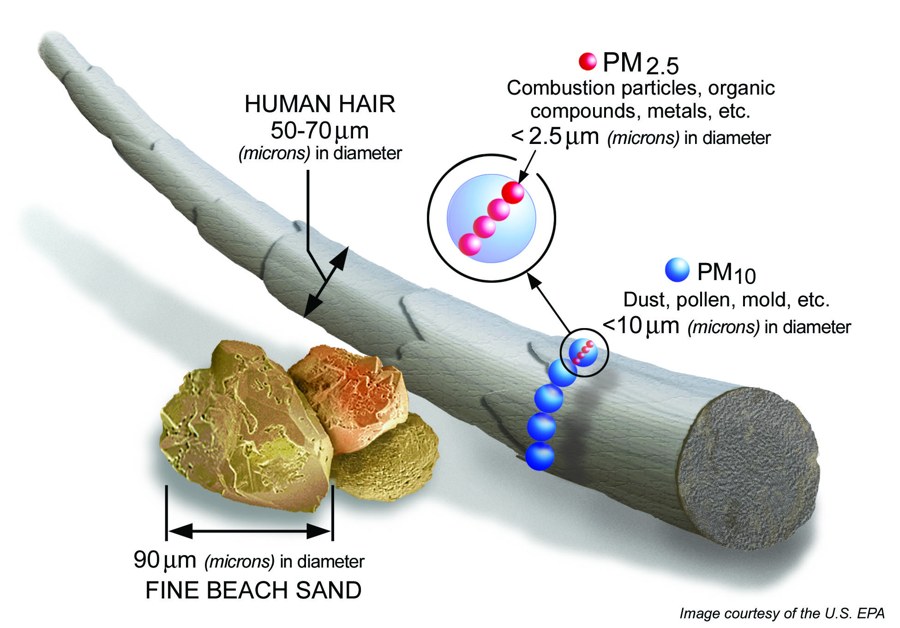
Coarse particulate matter, 10 microns or smaller. Includes dust and pollen. Common sources include road dust, construction, and agriculture.Relative size of PM₂.₅ and PM₁₀ compared to a human hair and grain of sand.Source:AirNow.gov
NO2
/
NOx
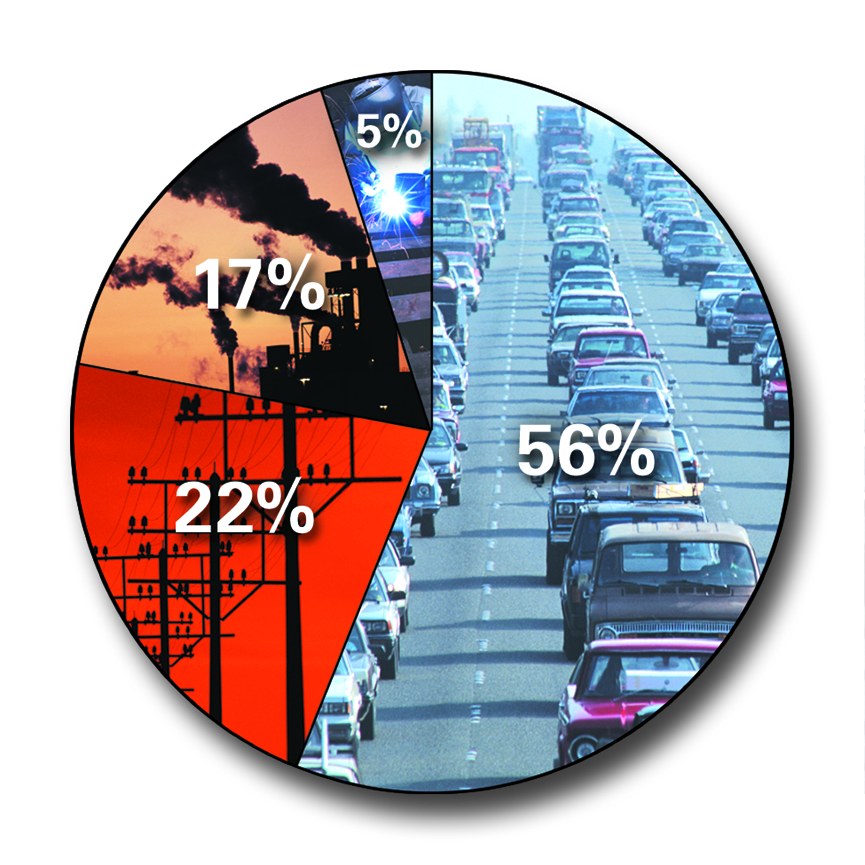
Nitrogen dioxide (NO₂) and nitrogen oxides (NOₓ) are traffic-related gas-phase pollutants that irritate airways and are precursors to ozone and particulate formation. Both come mainly from vehicle exhaust and industrial burning, especially near busy roads and freeways. NOₓ has no official EPA AQI of its own; it is shown on this dashboard using the NO₂ scale.U.S. sources of NOₓ emissions.Source:AirNow.gov
CO
Carbon monoxide is emitted during incomplete combustion, mostly by vehicle exhaust, and is most concentrated near heavy or idling traffic. CO reduces oxygen delivery in the bloodstream at high concentrations.
Ozone
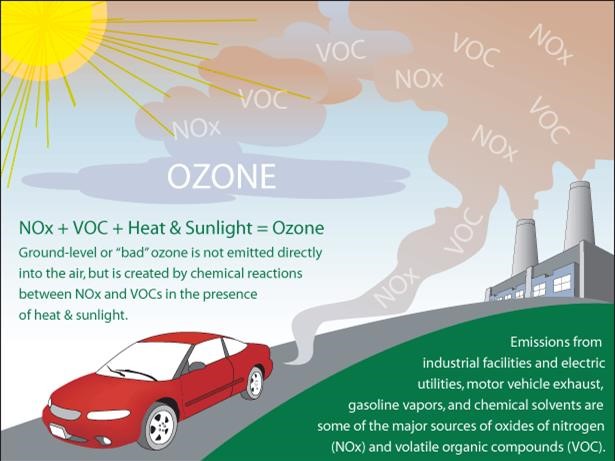
Ground-level ozone (O₃) isn't directly emitted, but forms from NOₓ and VOCs in the presence of sunlight. Ozone tends to peak on hot sunny days when traffic and industrial emissions are high. This pollutant causes lung irritation.How ground-level ozone forms.Source:EPA.gov
BC
Black carbon (soot from incomplete combustion, e.g. diesel exhaust and wood smoke) is a marker for combustion-related particulate pollution. It is measured at some regulatory monitors (Berkeley Aquatic Park and Oakland West) and at the Lifers sites that have a BC instrument (105th Ave, Church St and 50th Ave). There is no official EPA AQI scale for black carbon. On this dashboard, it is shown in 6 concentration ranges (see the Map tab's legend).
Air Toxics (VOCs and metals)
Lifers also samples dozens of volatile organic compounds (VOCs) and metals, collected every 6 days at three of the network's monitoring sites (105th Ave, Church St and 50th Ave). Additional short period VOC samples (also known as "grab" samples) are collected manually using Summa canisters by the Lifers team at specific locations where pollution or waste has been found. All of this is shown on the Air Toxics tab, along with information on each air toxic that was sampled. Because these samples are analyzed in a laboratory, results appear as soon as the lab data is available rather than in real time.
Lifers' network includes several different kinds of instruments to measure a wide range of pollutants.
Clarity Node-S
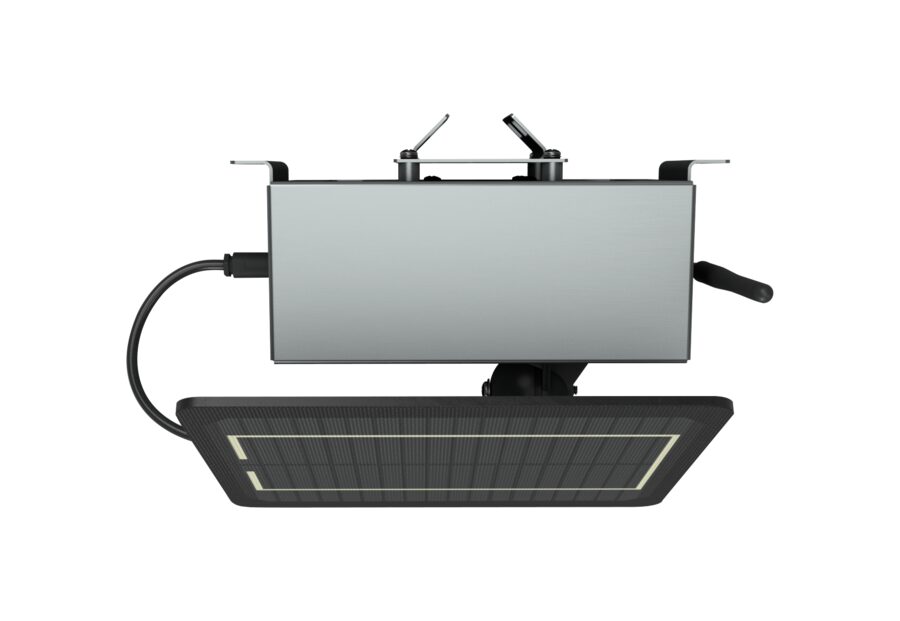
Most of the network's continuous monitoring runs on the Clarity Node-S, a solar-powered, weatherproof sensor that measures fine particulate matter (PM₂.₅) and nitrogen dioxide (NO₂) 24 hours a day. All Lifers Clarity sensors also measure wind speed/direction and pollutant gases (CO, NO, NOₓ, and ozone).
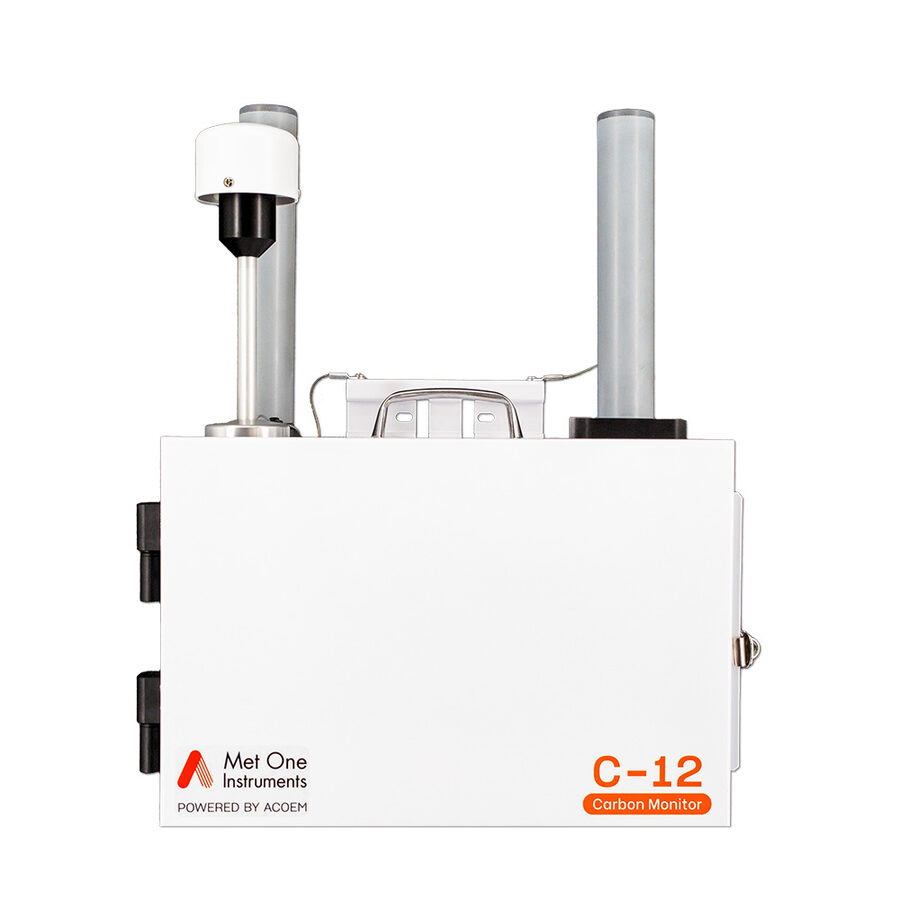
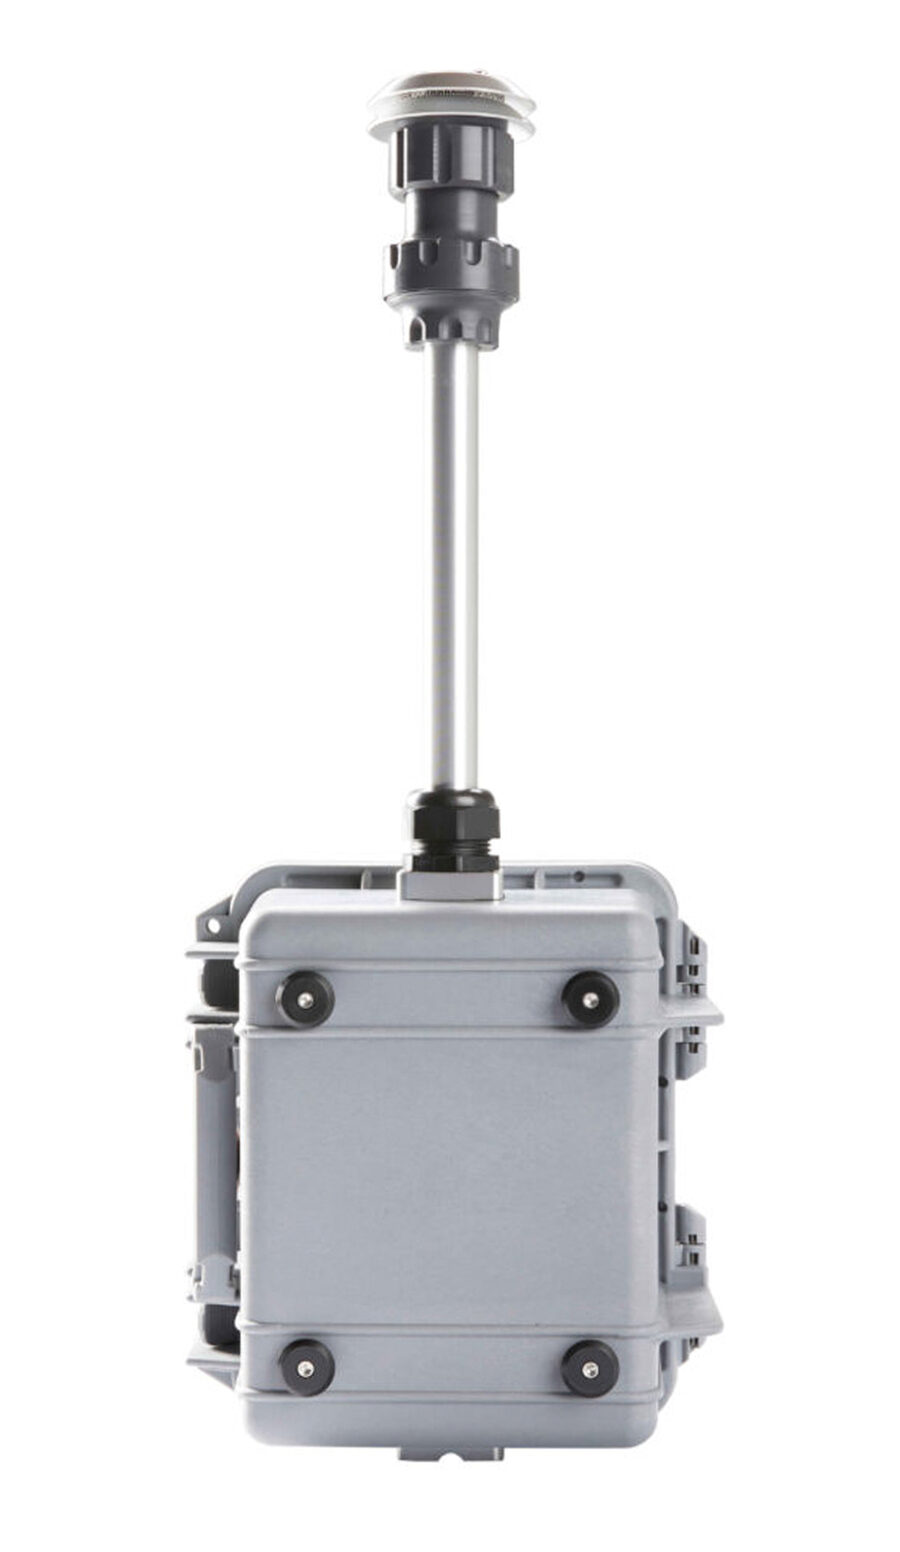
Black carbon is measured with the Met One Instruments C-12, a compact, solar- and cellular-powered monitor that reports black carbon concentration at two wavelengths, 370 nm and 880 nm every minute. Comparing the data collected at the two wavelengths helps distinguish wood and biomass burning smoke, which absorbs more strongly at 370 nm wavelength, from soot emitted by vehicle and diesel exhaust, which absorbs more strongly at 880 nm.
Metals in the air are sampled with MiniVol portable air samplers -- battery-powered pumps that pull air through a filter at a controlled flow rate over a 24-hr period, every six days. These filters are collected and sent to a laboratory, where the metals are analyzed using X-ray fluorescence (XRF) methodology.Airmetrics MiniVol TAS portable air sampler.Source:Air Metrics
Summa Canisters (VOCs)
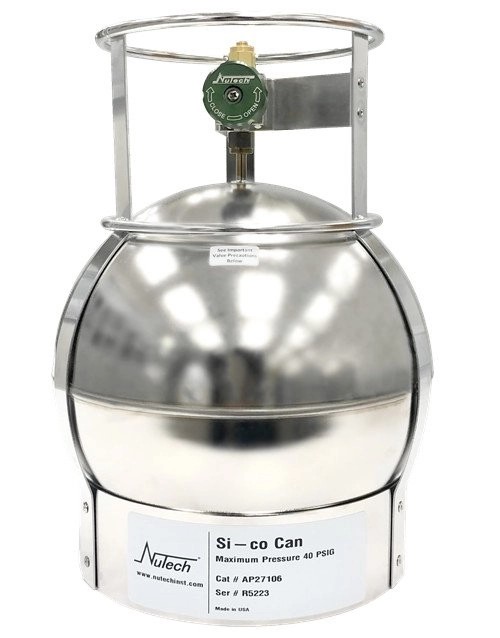
Volatile organic compounds (VOCs) are collected in evacuated stainless-steel Summa canisters, following U.S. EPA Method TO-15. A Nutech automatic sampler controls the flow of air into each canister at a steady rate over a 24-hr sampling period every six days; the canisters are then shipped to a laboratory, where the VOCs are identified and quantified by gas chromatography-mass spectrometry.
A Summa canister, used to collect VOC air samples.Source:Nutech Instruments
Data source and details
This dashboard reads and displays the newest data every 10 minutes for real-time pollutants and as soon as lab data is available for the air toxics. For real-time data, this dashboard time stamps the data at the end of the collection period. For example, data collected between 6:00 pm and 6:59 pm gets a label of 7:00 pm for consistency with AirNow's Fire and Smoke Map as well as AQI convention.
Wind speed and direction are measured at all five Lifers sites, but the Real-Time Map shows only 105th Ave, for simplicity. The wind box in the lower-left corner of the map shows an arrow pointing in the direction the wind is blowing toward (not the direction it's coming from), and the arrow's length grows with wind speed in mph. For winds below about 1 mph (calm conditions), it shows a calm note instead of an arrow. Wind information for every site can be viewed on the Advanced tab.
Funding Source
This project is part of California Climate Investments, which uses billions of Cap-and-Invest dollars to fund projects that reduce harmful emissions, protect public health, strengthen local economies, and support natural environments. With a strong focus on communities most impacted by pollution and limited access to resources, California Climate Investments helps build a more equitable and sustainable future.
Project Partners
Partners proudly supporting Lifers on this important project:
Impact icons on the Air Toxics tab:OpenMoji – the open-source emoji and icon project. License:CC BY-SA 4.0.